Monitor an Instance
The instance detail page shows the current health and resource usage of your service instance. Disk usage, CPU and memory usage, and the log viewer are all available in the Technical Details accordion.
Open the Technical Details
- Navigate to the instance detail page.
- Expand the Technical Details accordion.
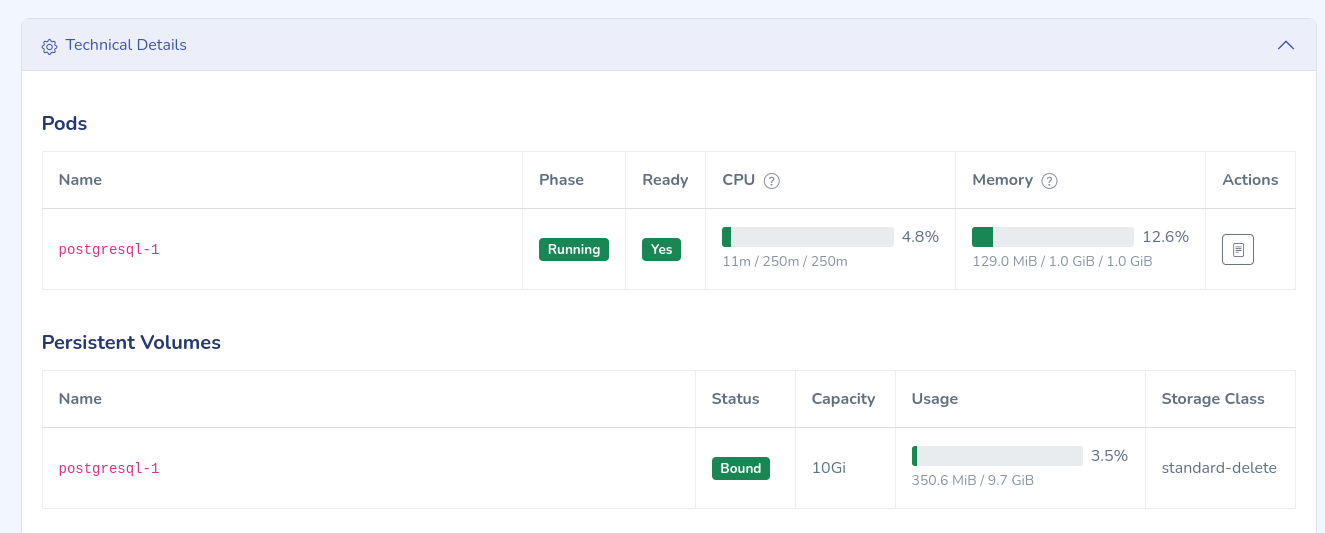
Check CPU and memory usage
The Pods table lists the running pods of your service instance. For each pod you see:
- Phase: the lifecycle state of the pod (for example
Running). - Ready: whether the pod is ready to serve requests.
- CPU: current CPU usage as a percentage, with the absolute values below it
(usage / request / limit, for example
11m / 250m / 250m). - Memory: current memory usage as a percentage, with the absolute values below
it (usage / request / limit, for example
129.0 MiB / 1.0 GiB / 1.0 GiB).
The percentage is measured against the configured limit. If a pod consistently runs close to its CPU or memory limit, consider moving to a larger compute plan.
Check disk usage
The Persistent Volumes table shows the storage attached to your instance. For each volume you see:
- Status: whether the volume is bound and in use (for example
Bound). - Capacity: the total provisioned size (for example
10Gi). - Usage: how much of the volume is used, as a percentage and in absolute terms
(for example
350.6 MiB / 9.7 GiB). - Storage Class: the storage class backing the volume.
You may notice that the available size shown under Usage is slightly smaller
than the provisioned Capacity (for example 9.7 GiB available on a 10Gi
volume). This is expected. When the volume is formatted with a filesystem, part of
the raw capacity is taken up by filesystem metadata (such as the journal and inode
tables) and by blocks the filesystem reserves for internal use. The remaining space
is what your service can actually write to, so the usage percentage is calculated
against this usable size rather than the raw provisioned size.
When a volume approaches its capacity, plan to increase the storage size. See Scaling for details.
Warning
A full data volume can cause the service to stop accepting writes or fail to start. Act before the volume reaches its capacity.
Check alerts
The Alerts card on the instance detail page lists the alert rules that watch your instance. See Monitoring for what the lists and severities mean.
- Navigate to the instance detail page.
- Expand the Alerts card. If an alert is firing, the card is already open and a banner at the top of the page shows how many alerts fire. Click See details below in the banner to jump to the card.
- Click the refresh button in the top right corner of the card to load the current state.
The card can also show one of these messages:
- This instance is not running yet: the instance is still being set up. Alerts start when it runs.
- Could not reach monitoring: the portal could not check which alerts fire right now. The list of alert rules still shows. Try again later.
- Alerting is not available on this control plane yet: the alert rules exist, but nobody is notified about them.
- No alerts are set up for this instance: nothing is being watched for this instance.
For the steps to take when an alert fires, see the Alert Runbooks.
Mute an alert
You need the Administrator or Owner role in the organization to mute an alert. You can only mute an alert that is firing now.
- In the Firing now list of the Alerts card, click Mute next to the alert.
- In Mute for, choose how long to mute the alert: 1 hour, 4 hours, 24 hours, or 7 days.
- In Reason, write why you mute the alert. The reason is recorded in the audit log.
- Click Mute.
The alert now shows a Muted label and the time when the mute ends. If the card does not show the change yet, wait a moment and click the refresh button.
To end a mute early, click Unmute next to the muted alert.
Check backups
For services that expose backup information, the instance detail page shows a Backup Summary card with the last backup, the schedule, the retention, and the number of available backups, plus a Backups section listing the individual backups. See Backups for what the fields mean and how to request a restore.
View logs
Each pod in the Pods table has a log viewer button in the Actions column.
- In the Pods table, find the pod whose logs you want to inspect.
- Click the log viewer button in the Actions column.
If the service runs multiple containers in a pod, the log viewer lets you choose which container to show logs for.
For downloading logs and troubleshooting tips, see the View Logs guide.